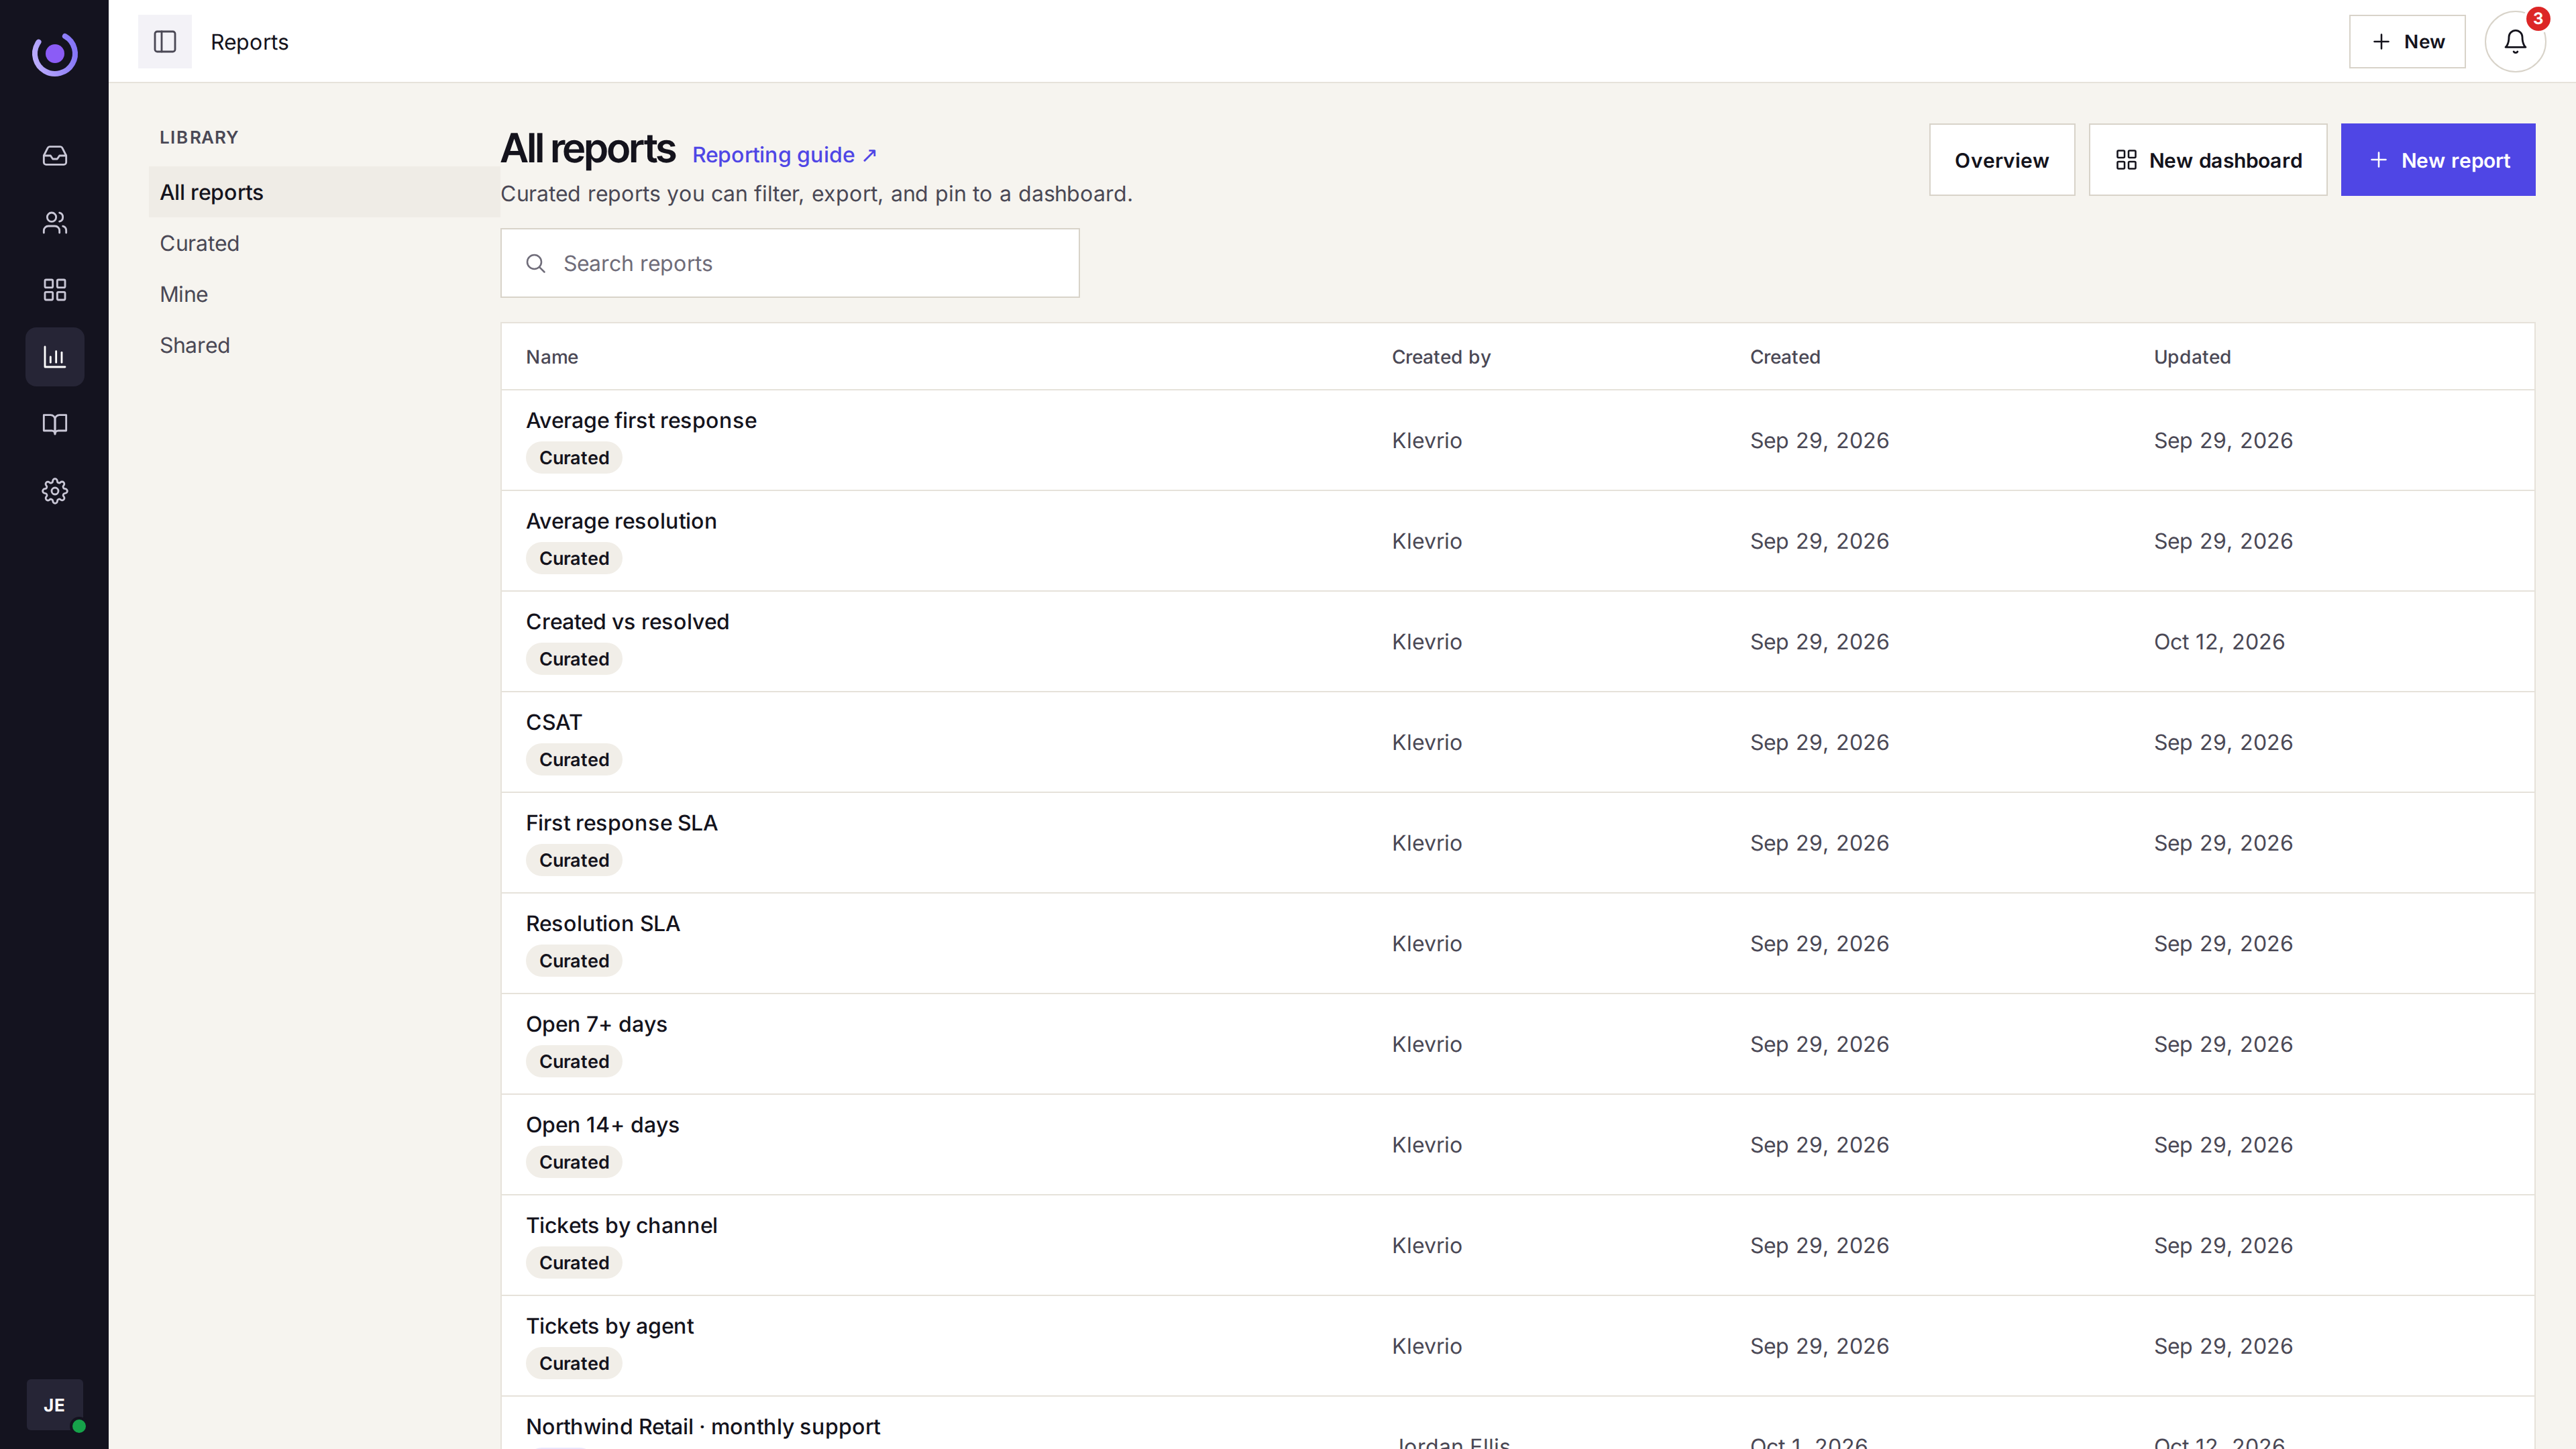
Reports
Know if the queue is winning — this week.
See created vs resolved, first response, resolution time, SLA, and satisfaction in one overview. Custom dashboards are on Growth when you outgrow the defaults.
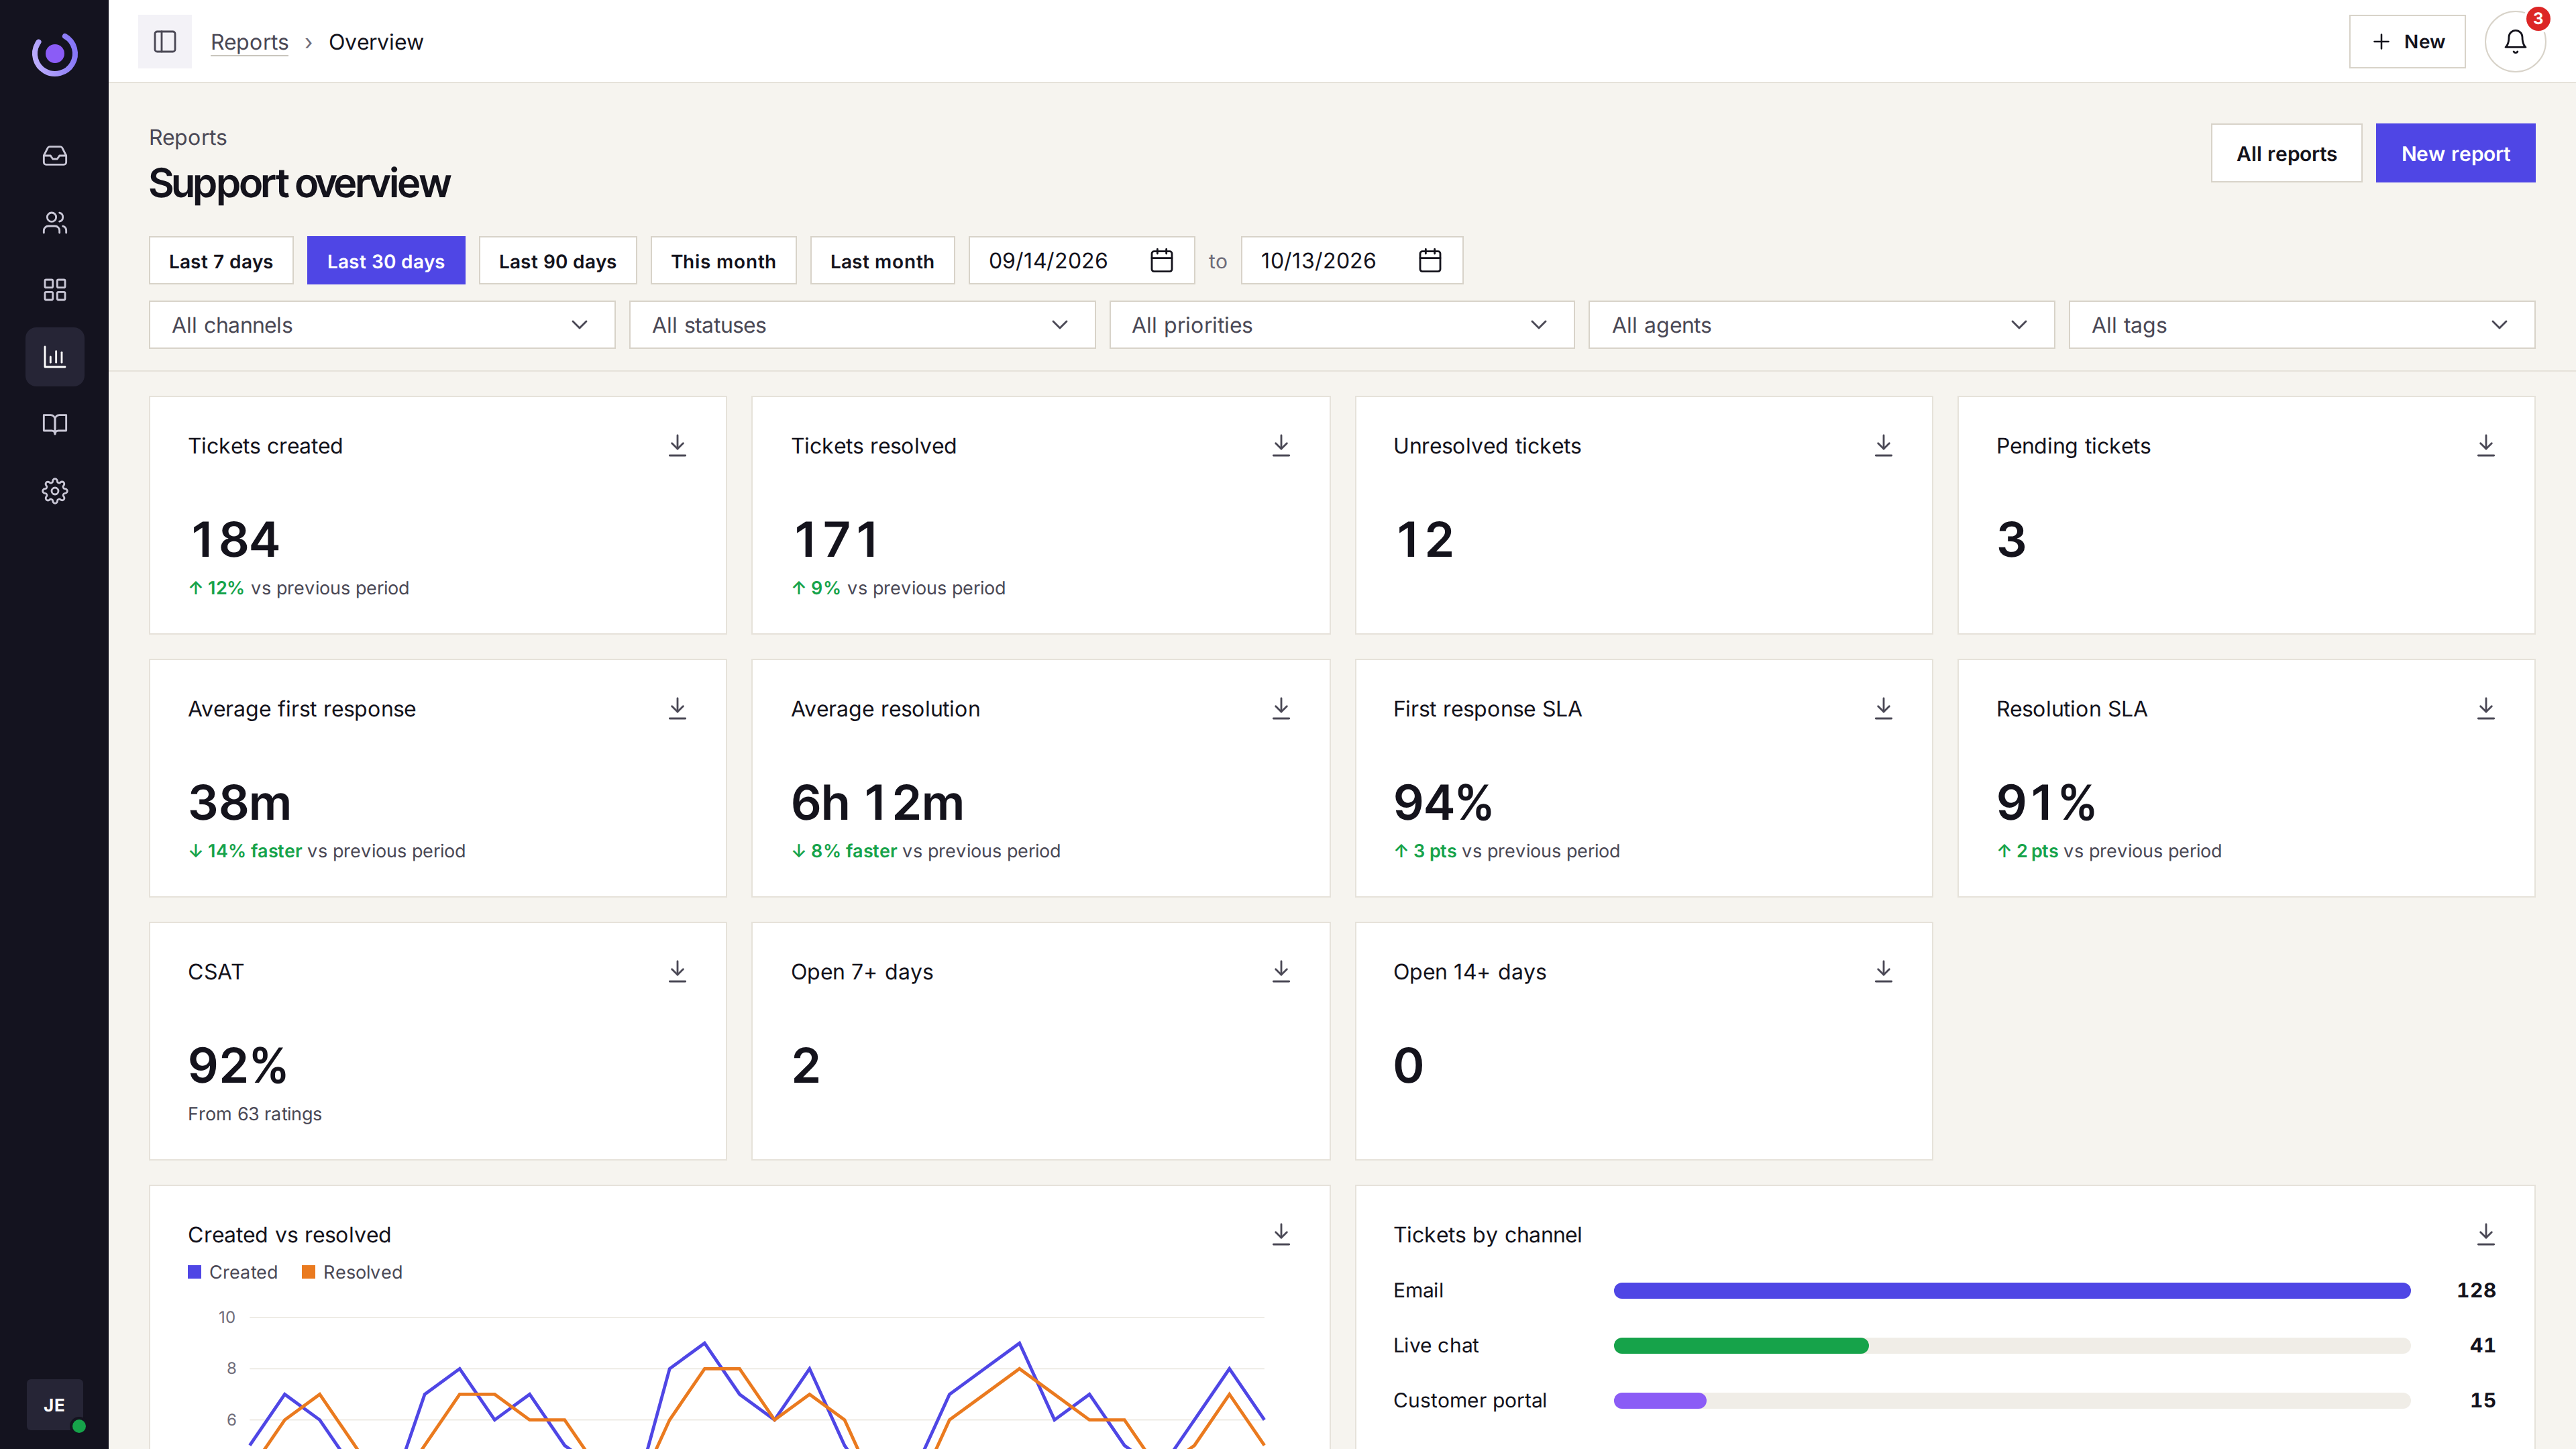
The support overview
Created, resolved, unresolved, pending, average first response, average resolution, first-response SLA, resolution SLA, satisfaction, and aged open tickets.
- Volume Tickets created and resolved in the selected dates.
- Response time Average first response and average resolution.
- Satisfaction CSAT from the survey sent when a ticket is closed.
Charts from the same queue
Created versus resolved by day, tickets by channel, priority, and agent, and first-response SLA by week.
- Channel and priority See where volume comes from: email, live chat, and the portal.
- An SLA, on Growth First response and resolution targets feed the SLA cards when service levels are on.
- Filters Date range, channel, status, priority, agent, and tag.
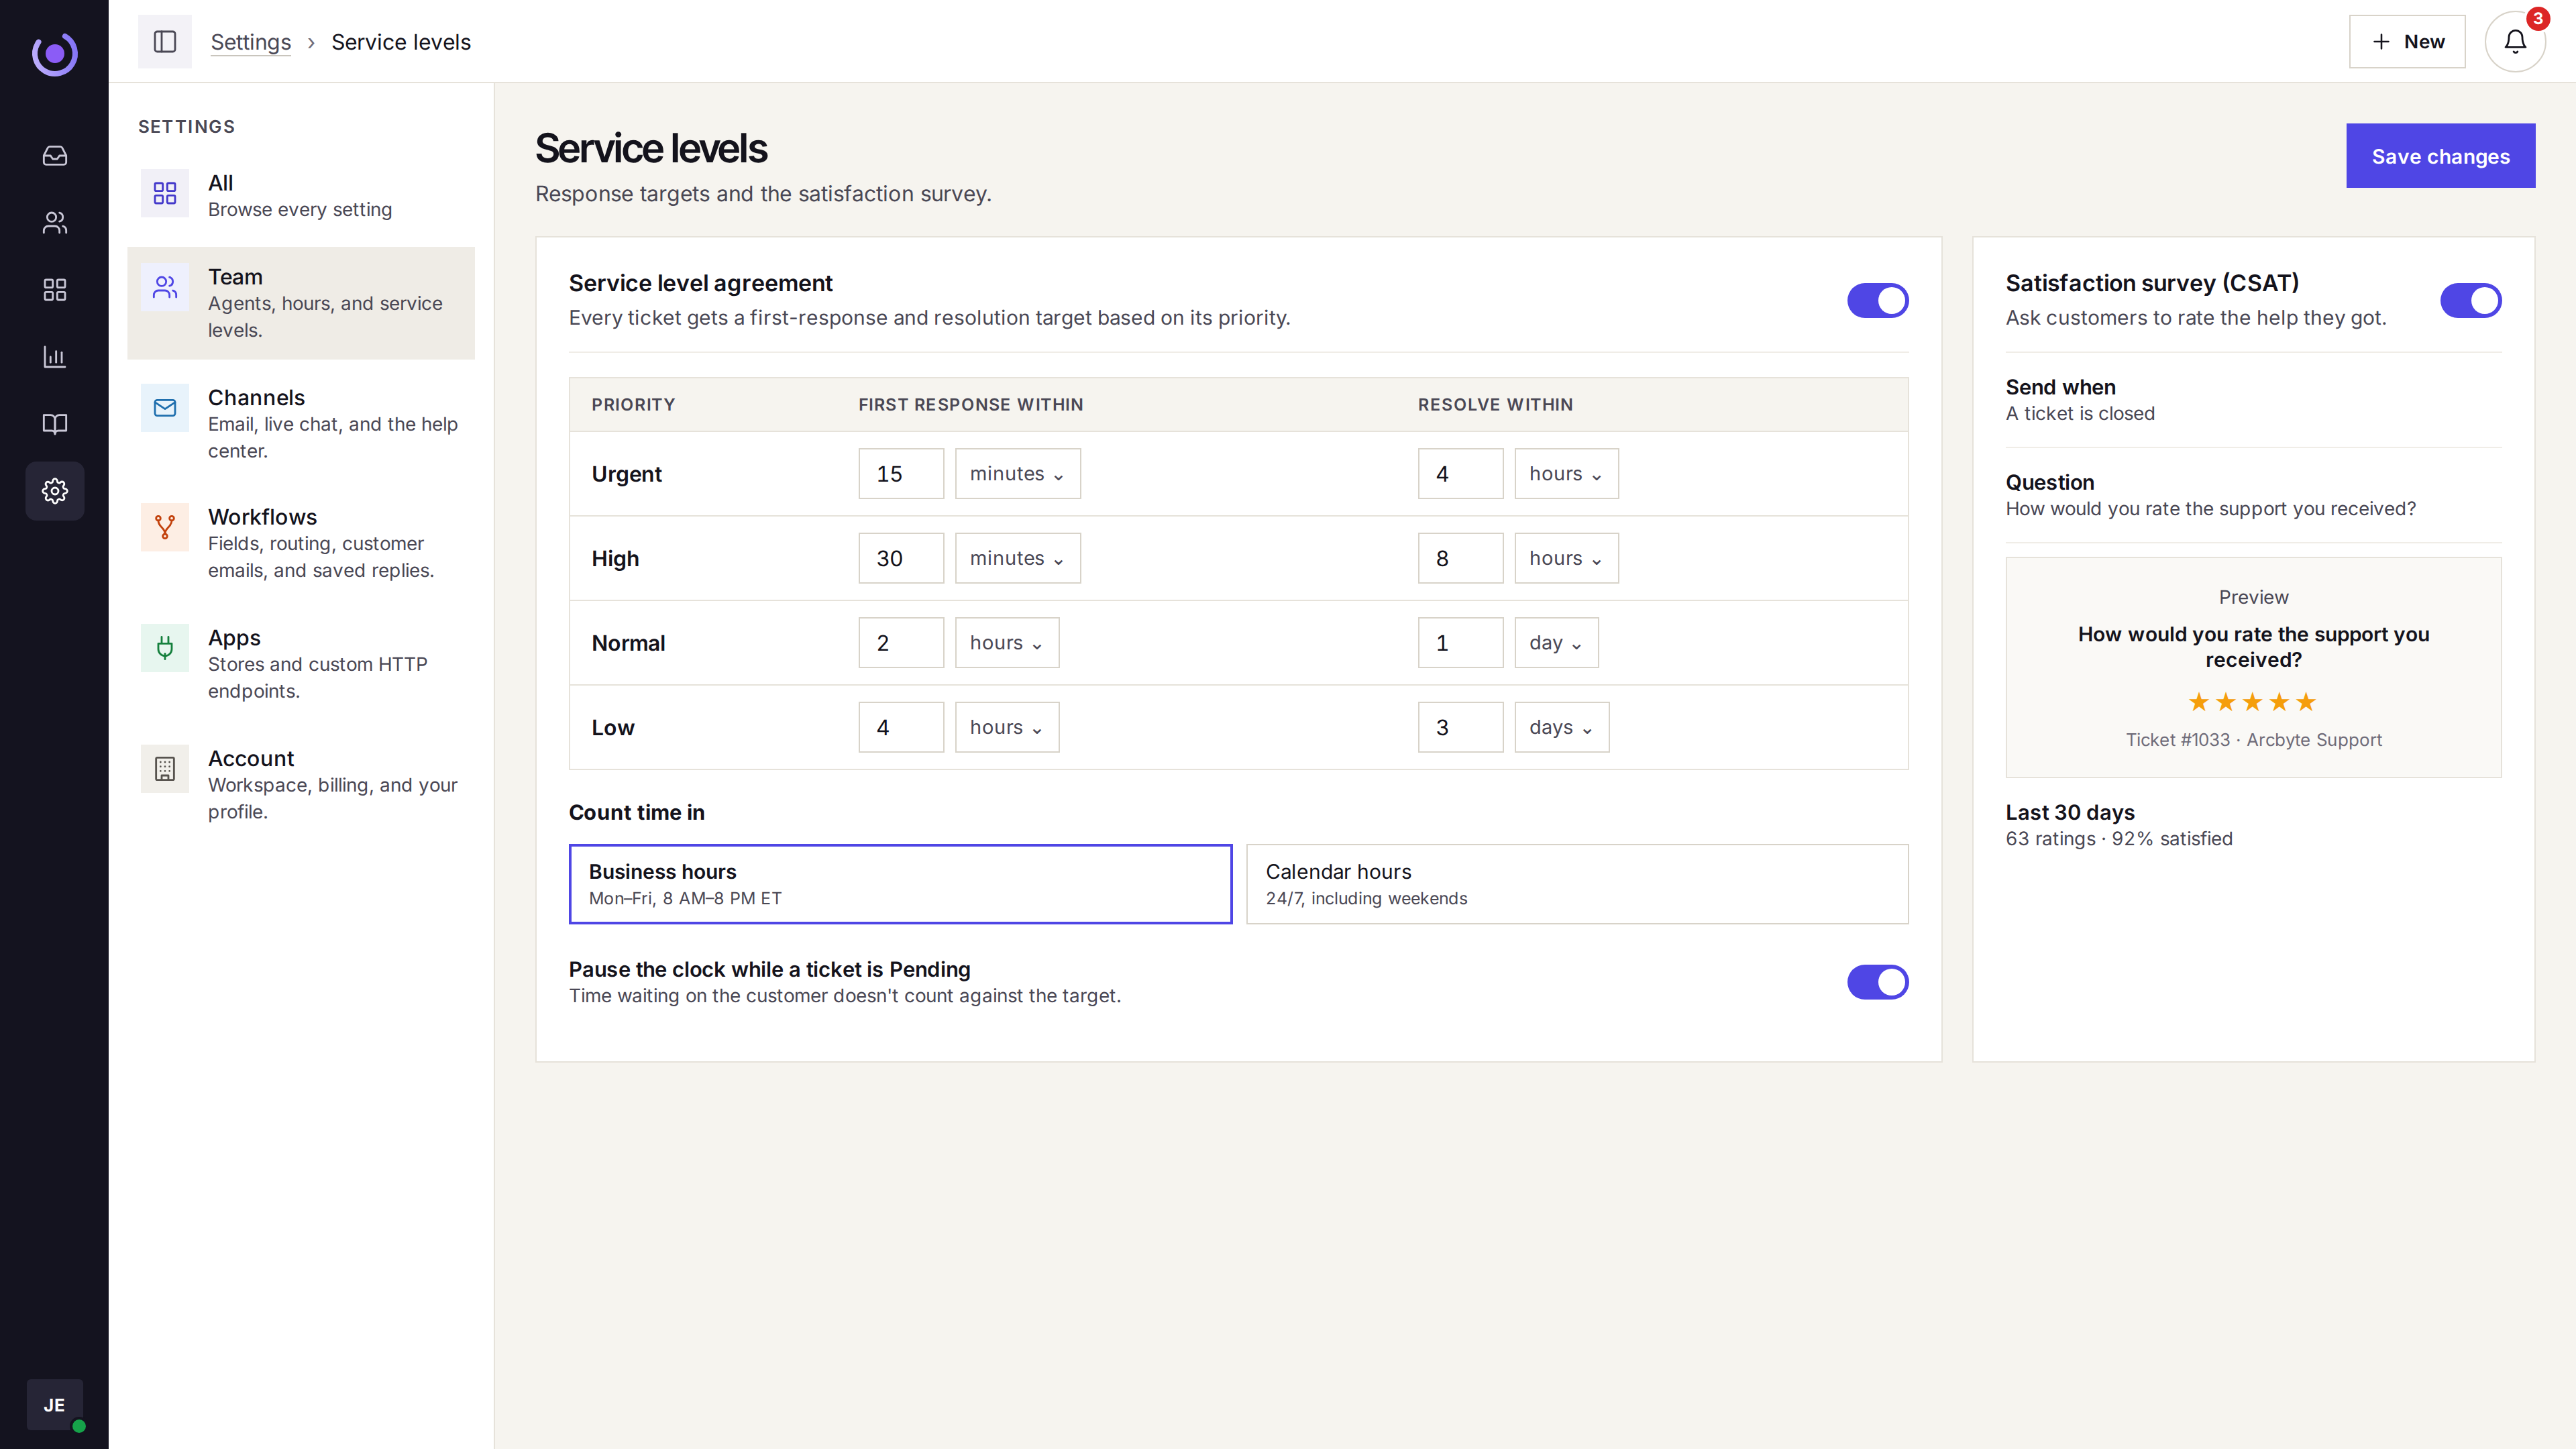
Custom dashboards on Growth
Starter shows the built-in overview. Growth adds dashboards you arrange, up to three. Business is unlimited.
- Custom dashboards On Growth, build dashboards beyond the built-in overview.
- Still those measures A custom dashboard does not add channels or scores the product does not collect.
- Saved reports A saved report can also break down by type or company.